Mountain Math/Language Home
(801) 475-1963
Secure Online Review Sign In
View Shopping Cart Store Videos Contact
Product View 1
< >
Description  |  Concepts  |  TEKS  |  COMPARE
WHAT YOU GET:
• 32 WEEKS OF DAILY REVIEW
• INSTRUCTIONS
• ONE MASTER STUDENT RESPONSE SHEET
• ANSWER KEY
• HEAVY DUTY STAND
• KNOWLEDGEABLE STAFF FOR ANY ASSISTANCE

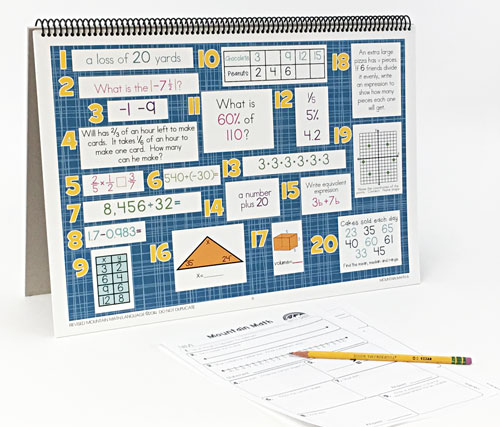
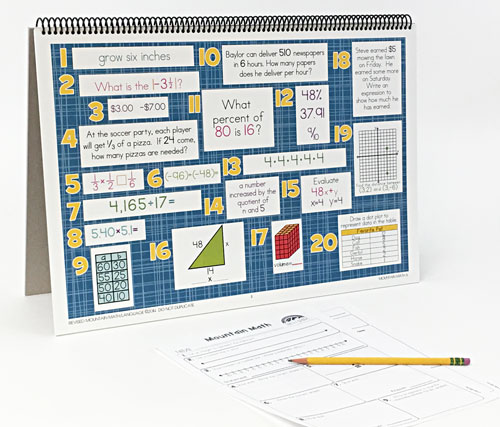
This 6th GRADE MOUNTAIN MATH CENTER EDITION is the DAILY REVIEW your students need to MASTER the concepts you have taught.

Research has proven that LONG-TERM MASTERY comes from SPIRAL REVIEW, also called DISTRIBUTED PRACTICE AND SPACED REPETITION.

The CENTER EDITION is designed for small group review, such as rotations, scoots, centers, or math-around-the-room. It is a smaller version (13"x19") of our Bulletin Board Kit. It can easily be set up and taken down as needed.
  1. Identify a number, its opposite, and its absolute value.
    Order a set of rational numbers arising from mathematical and real-world contexts.
  2. Locate, compare, and order integers and rational numbers using a number line.
  3. Locate, compare, and order integers and rational numbers using a number line.
    Order a set of rational numbers arising from mathematical and real-world contexts.
  4. Extend representations for division to include fraction notation such as a/b represents the same number as a ÷ b where b ≠ 0.
    Multiply and divide positive rational numbers fluently.
  5. Recognize that dividing by a rational number and multiplying by its reciprocal result in equivalent values.
    Determine, with and without computation, whether a quantity is increased or decreased when multiplied by a fraction, including values greater than or less than one.
  6. Represent integer operations with concrete models and connect the actions with the models to standardized algorithms.
    Add, subtract, multiply, and divide integers fluently.
  7. Add, subtract, multiply, and divide integers fluently.
  8. Add, subtract, multiply, and divide integers fluently.
  9. Compare two rules verbally, numerically, graphically, and symbolically in the form of y = ax or y = x + a in order to differentiate between additive and multiplicative relationships.
    Identify independent and dependent quantities from tables and graphs.
    Write an equation that represents the relationship between independent and dependent quantities from a table.
    Represent a given situation using verbal descriptions, tables, graphs, and equations in the form y = kx or y = x + b.
  10. Apply qualitative and quantitative reasoning to solve prediction and comparison of real-world problems involving ratios and rates.
    Give examples of ratios as multiplicative comparisons of two quantities describing the same attribute.
    Give examples of rates as the comparison by division of two quantities having different attributes, including rates as quotients.
    Convert units within a measurement system, including the use of proportions and unit rates.
    Represent mathematical and real-world problems involving ratios and rates using scale factors, tables, graphs, and proportions.
  11. Represent ratios and percents with concrete models, fractions, and decimals.
    Generate equivalent forms of fractions, decimals, and percents using real-world problems, including problems that involve money.
  12. Represent ratios and percents with concrete models, fractions, and decimals.
    Represent benchmark fractions and percents such as 1%, 10%, 25%, 33⅓%, and multiples of these values using 10 by 10 grids, strip diagrams, number lines, and numbers.
    Generate equivalent forms of fractions, decimals, and percents using real-world problems, including problems that involve money.
    Use equivalent fractions, decimals, and percents to show equal parts of the same whole.
  13. Multiply and divide positive rational numbers fluently.
    Generate equivalent numerical expressions using order of operations, including whole number exponents and prime factorization.
  14. Generate equivalent numerical expressions using order of operations, including whole number exponents and prime factorization.
    Distinguish between expressions and equations verbally, numerically, and algebraically.
    Write one-variable, one-step equations and inequalities to represent constraints or conditions within problems.
  15. Determine if two expressions are equivalent using concrete models, pictorial models, and algebraic representations.
    Generate equivalent expressions using the properties of operations: inverse, identity, commutative, associative, and distributive properties.
    Write one-variable, one-step equations and inequalities to represent constraints or conditions within problems.
    Represent solutions for one-variable, one-step equations and inequalities on number lines.
    Write corresponding real-world problems given one-variable, one-step equations or inequalities.
    Determine if the given value(s) make(s) one-variable, one-step equations or inequalities true.
  16. Extend previous knowledge of triangles and their properties to include the sum of angles of a triangle, the relationship between the lengths of sides and measures of angles in a triangle, and determining when three lengths form a triangle.
    Model and solve one-variable, one-step equations and inequalities that represent problems, including geometric concepts.
  17. Model area formulas for parallelograms, trapezoids, and triangles by decomposing and rearranging parts of these shapes.
    Write equations that represent problems related to the area of rectangles, parallelograms, trapezoids, and triangles and volume of right rectangular prisms where dimensions are positive rational numbers.
    Determine solutions for problems involving the area of rectangles, parallelograms, trapezoids, and triangles and volume of right rectangular prisms where dimensions are positive rational numbers.
  18. Write one-variable, one-step equations and inequalities to represent constraints or conditions within problems.
    Represent solutions for one-variable, one-step equations and inequalities on number lines.
    Model and solve one-variable, one-step equations and inequalities that represent problems, including geometric concepts.
  19. Measurement and data. Apply mathematical process standards to use coordinate geometry to identify locations on a plane. Graph points in all four quadrants using ordered pairs of rational numbers.
  20. Represent numeric data graphically, including dot plots, stem-and-leaf plots, histograms, and box plots.
    Use the graphical representation of numeric data to describe the center, spread, and shape of the data distribution.
    Summarize numeric data with numerical summaries, including the mean and median (measures of center) and the range and interquartile range (IQR) (measures of spread), and use these summaries to describe the center, spread, and shape of the data distribution.
    Summarize categorical data with numerical and graphical summaries, including the mode, the percent of values in each category (relative frequency table), and the percent bar graph, and use these summaries to describe the data distribution.
    Interpret numeric data summarized in dot plots, stem-and-leaf plots, histograms, and box plots.
    Distinguish between situations that yield data with and without variability.
TEXAS ESSENTIAL KNOWLEDGE AND SKILLS CORRELATION
  1. 6.2B, 6.3E
  2. 6.2BC
  3. 6.2CD
  4. 6.2E, 6.3E
  5. 6.3AB
  6. 6.3CD
  7. 6.3E
  8. 6.3E
  9. 6.4A, 6.6ABC
  10. 6.4BCDH, 6.5A
  11. 6.4E, 6.5B
  12. 6.4EFG, 6.5C
  13. 6.7A, 6.3E
  14. 6.7AB, 6.9A
  15. 6.7CD, 6.9AC, 6.10B
  16. 6.8A
  17. 6.8BCD
  18. 6.9AB, 6.10A
  19. 6.11A
  20. 6.12ABCD, 6.13AB
ONLINE REVIEW VS.
CENTER EDITION VS.
BULLETIN BOARD KIT
ONLINE REVIEW
Is projected onto an interactive white board, creating a virtual board. It can be viewed by the entire classroom. Answers can be displayed onto the board at the click of a button. Up to seven questions can be isolated and magnified.

CENTER EDITION
Is organized on a 13"x19" flip chart. It can be viewed by 5-6 students at a time. It was designed for small group review, such as rotations, scoots, centers, or math-around-the-classroom. It has an answer key, heavy-duty stand, and high-gauged coil.

BULLETIN BOARD KIT
It is designed for total classroom view. It hangs on bulletin boards, walls, white boards, pocket charts, and science display boards. Once hung, it can remain displayed for the entire year. The cards can be interchanged, creating flexible and adjustable DAILY REVIEW.

$99.95 QTY:
Centers   |   6th Grade Math
MATH K 1 2 3 4 5 6 7 8 G P A
To preview a grade level, click on the grade icon.

This will display covered concepts, images, and more.

What teachers are saying about Mountain Math and Mountain Language:

"I love it!!! Thank you!"
-Linda Mercier